Tutorial: Graph perturbations with CellinaGAT#
CellinaGAT is a dual-encoder VAE that separates intrinsic cell state (\(z\)) from spatial context (\(s\)) using GATv2 attention over each cell’s local subgraph. The two latent spaces enable tissue-graph counterfactuals: hold a cell’s identity fixed and ask what it would express under a different neighbourhood.
%matplotlib inline
%reload_ext autoreload
%autoreload 2
import numpy as np
import scanpy as sc
import torch
import os
import matplotlib.pyplot as plt

from sklearn.model_selection import train_test_split
from scvi.train._callbacks import SaveCheckpoint, EarlyStopping
from scipy.stats import pearsonr

from cellina import CellinaGCN, make_perturbed_expression
from cellina._spatial_utils import spatial_neighbors
seed = 0
np.random.seed(seed)
torch.manual_seed(seed)
torch.cuda.manual_seed(seed)
torch.backends.cudnn.deterministic = True
torch.backends.cudnn.benchmark = False
1. Data preprocessing#
adata = sc.read(
    f"./data/crc_232.h5ad",
    backup_url=f"https://zenodo.org/records/15574384/files/232.h5ad?download=1"
)
adata.obs_names_make_unique()
label_to_coarse = {
    "epi1": "Epithelial", "epi2": "Epithelial", "epi3": "Epithelial", "epi4": "Epithelial",
    "fib1": "Fibroblast", "fib2": "Fibroblast",
    "EC": "Endothelial", "SMC": "Smooth_muscle",
    "BC": "B_cell",
    "PC_IgA": "Plasma_cell", "PC_IgG": "Plasma_cell", "PC_IgM": "Plasma_cell",
    "TC": "T_cell",
    "mye1": "Myeloid", "mye2": "Myeloid",
    "mast": "Mast_cell",
}
adata.obs["coarse_type"] = adata.obs['ist'].map(label_to_coarse)
labels_key = 'coarse_type'
domains_key = 'typ'
batch_key = None

adata = adata[~adata.obs[domains_key].isna()]
adata = adata[~adata.obs[labels_key].isna()]
sc.pp.filter_cells(adata, min_counts=3)
sc.pp.filter_genes(adata, min_counts=3)

adata.layers['counts'] = adata.X.copy()
sc.pp.highly_variable_genes(adata, layer='counts', flavor='seurat_v3', n_top_genes=2000, subset=True)
Data splits#
Hold out Myeloid cells in the cancer (CRC) region for out-of-distribution evaluation.
holdout_ct = 'Myeloid'
is_tumor_region = adata.obs[domains_key].str.contains("CRC", regex=True)
is_holdout_ct = adata.obs[labels_key] == holdout_ct

test_mask = is_tumor_region & is_holdout_ct
test_idx = np.where(test_mask)[0]

all_idx = np.arange(adata.n_obs)
trainval_idx = np.setdiff1d(all_idx, test_idx)

adata.obs['is_holdout'] = False
adata.obs.iloc[test_idx, adata.obs.columns.get_loc('is_holdout')] = True

train_idx, val_idx = train_test_split(trainval_idx, test_size=0.1, random_state=0, shuffle=True)
print("Train:", len(train_idx), "| Val:", len(val_idx), "| Test:", len(test_idx))
Train: 96258 | Val: 10696 | Test: 5035
Spatial graph#
CellinaGCN operates directly on the spatial graph — no pre-aggregation of neighbour features is needed. We build the adjacency with test nodes masked out to avoid data leakage, and store the original adjacency for counterfactual inference.
sc.pp.normalize_total(adata, target_sum=1e4)
sc.pp.log1p(adata)

max_neighbors = 20
adata.obsm['spatial'] = adata.obs[['CenterX_global_px', 'CenterY_global_px']].values
adata.obsp['spatial_connectivities_orig'] = spatial_neighbors(
    adata, bandwidth=100 / 0.12028, max_neighbours=max_neighbors,
    standardize=False, inplace=False
)
spatial_neighbors(
    adata, bandwidth=100 / 0.12028, max_neighbours=max_neighbors,
    standardize=False, test_indices=test_idx
)

adata.X = adata.layers['counts'].copy()  # reset to raw counts for CellinaGCN
2. Training#
train_args = {
    "max_epochs": 100,
    "batch_size": 2048,
    "check_val_every_n_epoch": 1,
    "early_stopping": True,
    "enable_checkpointing": True,
    "early_stopping_patience": 10,
    "early_stopping_monitor": "vae_loss_validation",
    "devices": [0],
    "datasplitter_kwargs": {"external_indexing": [train_idx, val_idx, test_idx]},
    "callbacks": [
        SaveCheckpoint(
            monitor='vae_loss_validation',
            dirpath=f"scvi_log/cellina_gcn/",
            load_best_on_end=True),
        EarlyStopping(
            monitor="vae_loss_validation",
            patience=10,
            mode="min"),
    ],
}

plan_kwargs = {
    "lr": 1e-3,
    "normalize_losses": True,
}
cellina_gcn_args = {
    "n_latent": 64,
    "use_observed_lib_size": True,
    "condition_on_intrinsic": False,
    "classifier_lambda": 1.0,
    "discriminator_lambda": 1.0,
    "link_prediction_weight": 1.0,
    "gene_likelihood": "nb",
    "n_layers": 2,
    "num_neighbors": [20, 20],
    "convolution_type": "gat",
}
CellinaGCN.setup_anndata(
    adata,
    batch_key=batch_key,
    labels_key=labels_key,
    domains_key=domains_key,
    spatial_connectivities_key='spatial_connectivities',
    layer='counts'
)
model = CellinaGCN(adata, **cellina_gcn_args)
INFO cellina: The CellinaGCN model has been initialized with adversarial domain forgetting with edge prediction
model.train(**train_args, plan_kwargs=plan_kwargs)
INFO     File
         /data/ddimitrov/repos/cellina/docs/scvi_log/cellina_gcn/epoch=6-step=576-vae_loss_validation=327.782806396
         4844/model.pt already downloaded
Monitored metric vae_loss_validation did not improve in the last 10 records. Best score: 327.783. Signaling Trainer to stop.
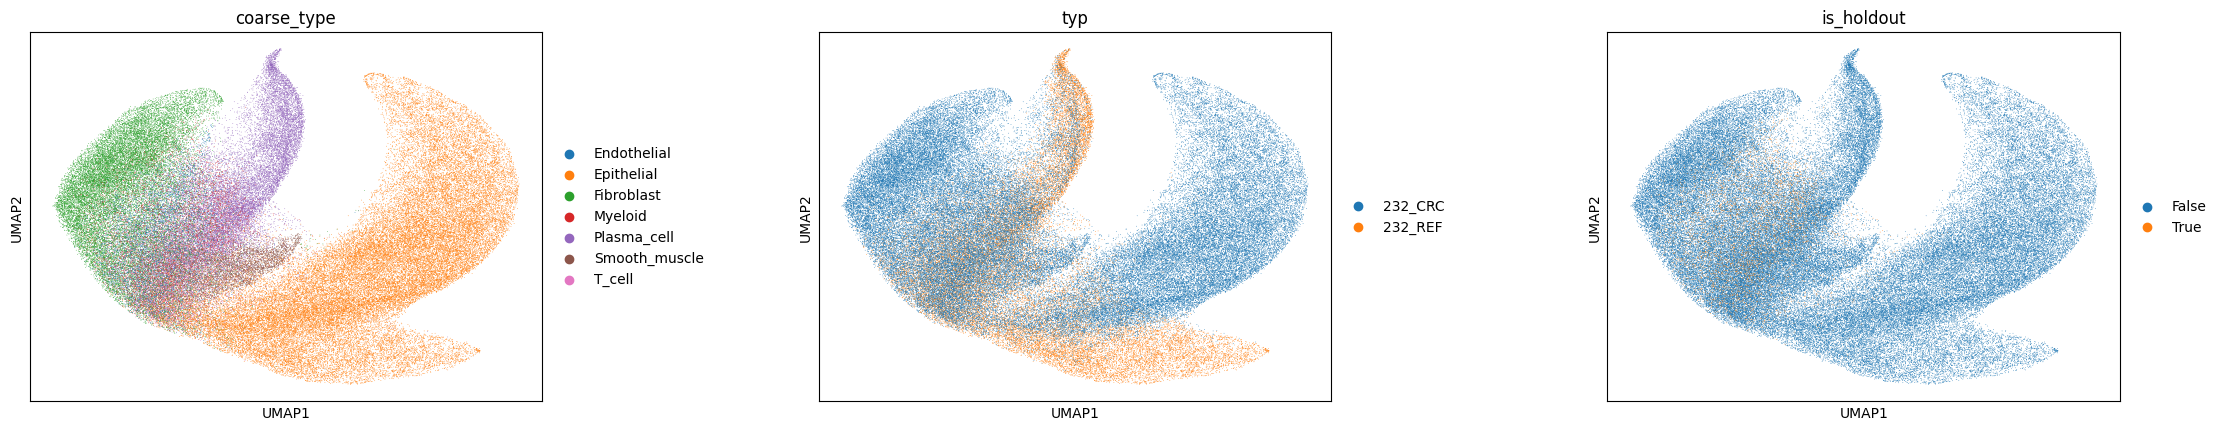
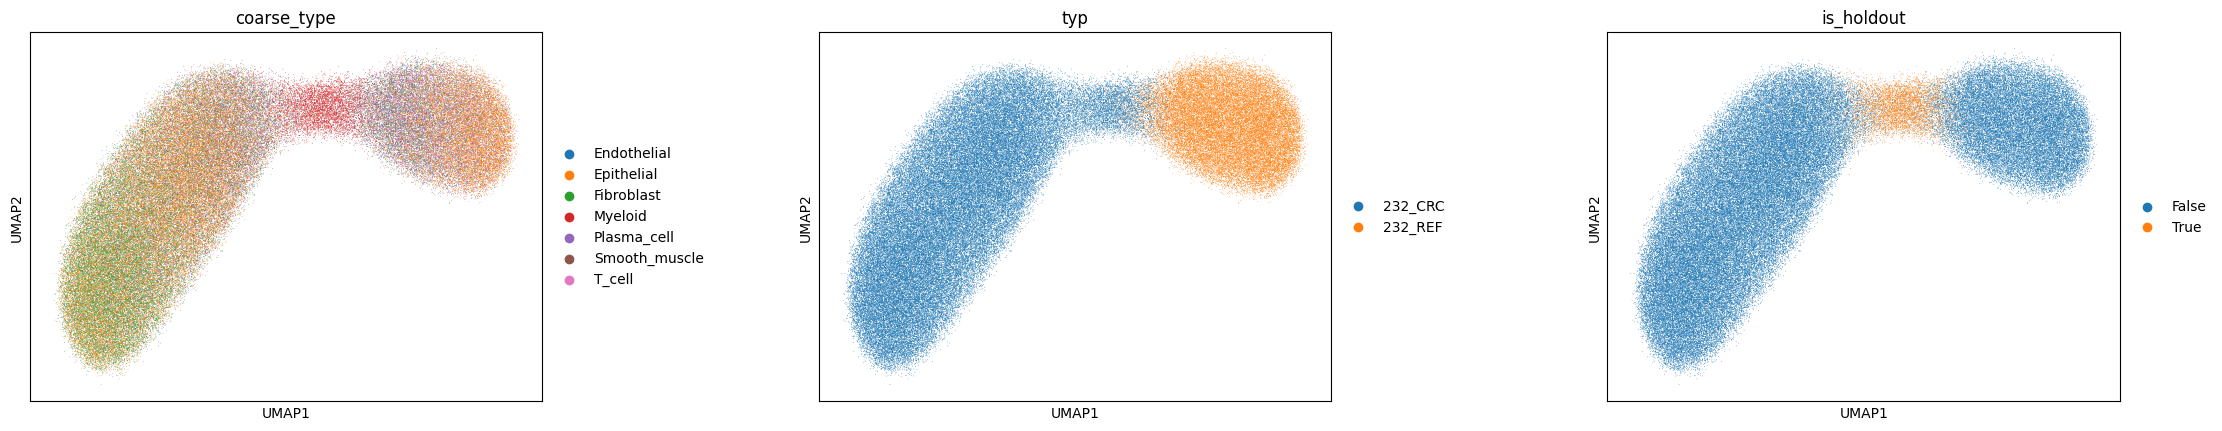
3. Qualitative Analysis#
If disentanglement worked, \(z\) clusters by cell type (adversary removed domain signal) and \(s\) organises by tissue region.
checkpoint_name = os.listdir("scvi_log/cellina_gcn/")[0]
model = CellinaGCN.load(
    f"scvi_log/cellina_gcn/{checkpoint_name}",
    adata=adata,
)
INFO     File scvi_log/cellina_gcn/epoch=6-step=576-vae_loss_validation=327.7828063964844/model.pt already
         downloaded
INFO     cellina: The CellinaGCN model has been initialized with adversarial domain forgetting with edge prediction
adata.obsm['cellina_basal'] = model.get_latent_representation(latent_key='z', batch_size=2048)
adata.obsm['cellina_spatial'] = model.get_latent_representation(latent_key='s', batch_size=2048)
sc.pp.neighbors(adata, use_rep='cellina_basal')
sc.tl.umap(adata)
sc.pl.umap(adata, color=[labels_key, domains_key, 'is_holdout'], wspace=0.4)
sc.pp.neighbors(adata, use_rep='cellina_spatial')
sc.tl.umap(adata)
sc.pl.umap(adata, color=[labels_key, domains_key, 'is_holdout'], wspace=0.4)
4. Counterfactuals#
is_control_region = adata.obs[domains_key].str.contains('REF')
mask_control = is_control_region & is_holdout_ct
idx_control = np.where(mask_control.values)[0]

mask_target = is_tumor_region & is_holdout_ct
idx_target = np.where(mask_target.values)[0]
def _normalize_counts(x, eps=1e-8, scale=1e4):
    return x / (x.sum(axis=1, keepdims=True) + eps) * scale

def safe_log2_fold_change(a, b, eps=1e-6):
    return np.log2((np.asarray(a) + eps) / (np.asarray(b) + eps))

def get_lfc(control, target, counterfactual, normalize_counts=True, n_deg=200):
    if normalize_counts:
        control = _normalize_counts(control)
        target = _normalize_counts(target)
        counterfactual = _normalize_counts(counterfactual)
    mean_control = np.nanmean(control, axis=0)
    mean_target = np.nanmean(target, axis=0)
    mean_cf = np.nanmean(counterfactual, axis=0)
    gt_vec = safe_log2_fold_change(mean_target, mean_control)
    cf_vec = safe_log2_fold_change(mean_cf, mean_control)
    top_features = np.argsort(-np.abs(gt_vec))[:n_deg]
    return gt_vec, cf_vec, top_features
from adjustText import adjust_text

def plot_lfc(true_lfc, pred_lfc, deg, gene_names, holdout_ct, pearson):
    fig, ax = plt.subplots(figsize=(6, 5.5))
    deg = np.asarray(deg)
    non_deg = np.setdiff1d(np.arange(len(true_lfc)), deg)
    ax.scatter(true_lfc[non_deg], pred_lfc[non_deg], alpha=0.25, s=8, color="lightgray",
               linewidths=0, rasterized=True)
    up = deg[true_lfc[deg] >= 0]
    down = deg[true_lfc[deg] < 0]
    ax.scatter(true_lfc[up], pred_lfc[up], s=45, color="#d62728",
               edgecolor="white", linewidths=0.5, zorder=3, label="up in cancer")
    ax.scatter(true_lfc[down], pred_lfc[down], s=45, color="#1f77b4",
               edgecolor="white", linewidths=0.5, zorder=3, label="down in cancer")
    texts = [ax.text(true_lfc[i], pred_lfc[i], gene_names[i], fontsize=8) for i in deg]
    adjust_text(texts, ax=ax, arrowprops=dict(arrowstyle="-", color="0.6", lw=0.5))
    lo = float(min(true_lfc.min(), pred_lfc.min()))
    hi = float(max(true_lfc.max(), pred_lfc.max()))
    pad = 0.05 * (hi - lo)
    lims = [lo - pad, hi + pad]
    ax.plot(lims, lims, "k--", lw=1, alpha=0.6, zorder=1)
    ax.set_xlim(lims); ax.set_ylim(lims); ax.set_aspect("equal")
    ax.set_xlabel("Observed logFC  (control → cancer)")
    ax.set_ylabel("Predicted logFC  (counterfactual)")
    ax.set_title(f"{holdout_ct}: observed vs. predicted logFC   (Pearson r = {pearson:.2f})")
    ax.legend(frameon=False, fontsize=8, loc="upper left")
    fig.tight_layout()
    plt.show()
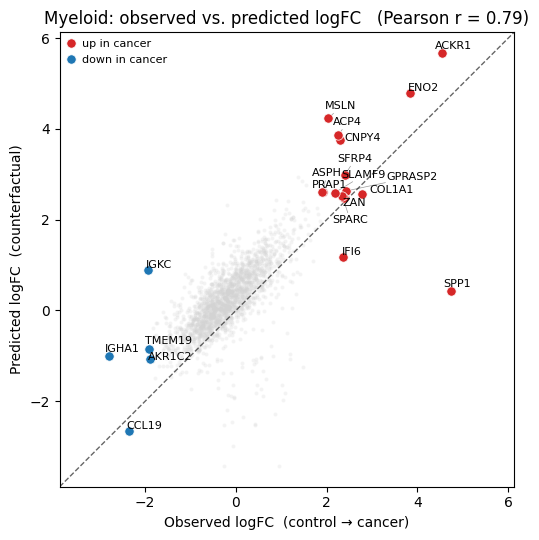
4.1 Edge perturbation#
Rewire each control Myeloid’s neighbourhood by sampling from the observed neighbours of cancer Myeloids (excluding Myeloids themselves). CellinaGCN aggregates over the rewired graph on the fly.
conn = adata.obsp["spatial_connectivities_orig"]
sub_conn = conn[idx_target]
neighbor_indices = np.unique(sub_conn.nonzero()[1])
neighbor_indices = neighbor_indices[~is_holdout_ct.values[neighbor_indices]]
counterfactual_counts = model.get_counterfactual_expression(
    indices=idx_control,
    neighbour_indices=neighbor_indices,
    n_neighbors_per_seed=20,
    batch_size=2048,
    seed=0,
    library_size=1e4,
)
control = np.array(adata.layers['counts'][mask_control.values, :].todense())
target = np.array(adata.layers['counts'][mask_target.values, :].todense())

true_lfc, pred_lfc, deg = get_lfc(control=control, target=target,
                                   counterfactual=counterfactual_counts, n_deg=50)
pearson, _ = pearsonr(true_lfc[deg], pred_lfc[deg])

gene_names = np.array(adata.var_names)
plot_lfc(true_lfc, pred_lfc, deg, gene_names, holdout_ct, pearson)
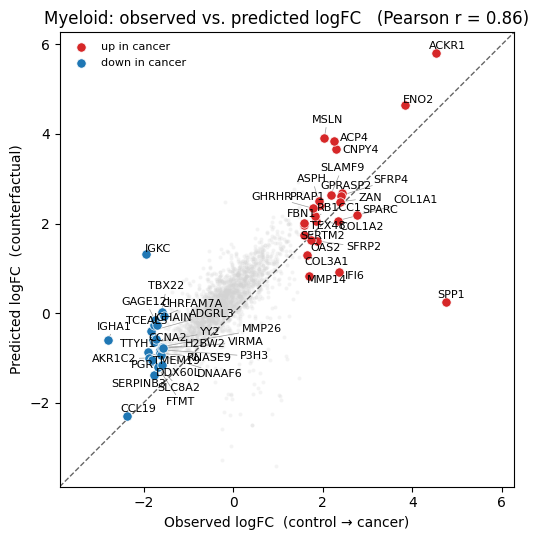
4.2 Node perturbation#
Keep graph topology fixed; shift the expression of each neighbour cell by the observed healthy→cancer log-fold change for its cell type (using the global average for the held-out Myeloid population). The GAT aggregates from the perturbed neighbour counts on the fly via cf_layer.
import pandas as pd
import scipy.sparse as sp
import decoupler as dc

n_pert_genes = 200
control_domain = '232_REF'
target_domain = '232_CRC'

def get_perturbation_logfc(adata, control_domain, holdout_domain, labels_key, domains_key):
    pdata_ct = dc.pp.pseudobulk(
        adata=adata, sample_col=domains_key, groups_col=labels_key, mode='sum', layer='counts'
    )
    sc.pp.normalize_total(pdata_ct, target_sum=1e4)
    sc.pp.log1p(pdata_ct)
    cell_types_with_both = [
        ct for ct in pdata_ct.obs[labels_key].unique()
        if ((pdata_ct.obs[domains_key] == control_domain) & (pdata_ct.obs[labels_key] == ct)).any()
        and ((pdata_ct.obs[domains_key] == holdout_domain) & (pdata_ct.obs[labels_key] == ct)).any()
    ]
    _ct_rows = []
    for _ct in cell_types_with_both:
        _crc_ct = pdata_ct[(pdata_ct.obs[domains_key] == holdout_domain) & (pdata_ct.obs[labels_key] == _ct)].X
        _ref_ct = pdata_ct[(pdata_ct.obs[domains_key] == control_domain) & (pdata_ct.obs[labels_key] == _ct)].X
        _crc_m = np.asarray(_crc_ct.mean(axis=0)).flatten() if sp.issparse(_crc_ct) else _crc_ct.mean(axis=0).flatten()
        _ref_m = np.asarray(_ref_ct.mean(axis=0)).flatten() if sp.issparse(_ref_ct) else _ref_ct.mean(axis=0).flatten()
        _ct_rows.append(pd.Series(_crc_m - _ref_m, index=pdata_ct.var_names, name=_ct))
    return pd.concat(_ct_rows, axis=1).T

def get_global_perturbation_logfc(adata, control_domain, holdout_domain, labels_key, domains_key, holdout_ct):
    adata_sub = adata[adata.obs[labels_key] != holdout_ct]
    pdata_global = dc.pp.pseudobulk(
        adata=adata_sub, sample_col=domains_key, groups_col=None, mode='sum', layer='counts'
    )
    sc.pp.normalize_total(pdata_global, target_sum=1e4)
    sc.pp.log1p(pdata_global)
    _holdout_X = pdata_global[pdata_global.obs[domains_key] == holdout_domain].X
    _control_X = pdata_global[pdata_global.obs[domains_key] == control_domain].X
    _holdout_mean = np.asarray(_holdout_X.mean(axis=0)).flatten() if sp.issparse(_holdout_X) else _holdout_X.mean(axis=0).flatten()
    _control_mean = np.asarray(_control_X.mean(axis=0)).flatten() if sp.issparse(_control_X) else _control_X.mean(axis=0).flatten()
    return pd.Series(_holdout_mean - _control_mean, index=pdata_global.var_names)
domain_logfc_df = get_perturbation_logfc(adata, control_domain, target_domain, labels_key, domains_key)
global_logfc_series = get_global_perturbation_logfc(adata, control_domain, target_domain, labels_key, domains_key, holdout_ct)
domain_logfc_df.loc[holdout_ct, global_logfc_series.index] = global_logfc_series

logfc_series_dict = {}
for ct in domain_logfc_df.index:
    s = domain_logfc_df.loc[ct]
    top_g = s.abs().nlargest(n_pert_genes).index.tolist()
    logfc_series_dict[ct] = s[top_g]
adata.X = adata.layers['counts'].copy()

make_perturbed_expression(
    adata,
    perturbations=logfc_series_dict,
    groupby=labels_key,
    layer_key='counts_cf',
    base=np.e,
    add_shift=False,
    renormalize=True,
)
pert_expr = model.get_perturbed_expression(
    adata=adata, indices=idx_control, cf_layer='counts_cf',
    batch_size=2048, library_size=1e4,
)
control = np.array(adata.layers['counts'][mask_control.values, :].todense())
target = np.array(adata.layers['counts'][mask_target.values, :].todense())

true_lfc, pred_lfc, deg = get_lfc(control=control, target=target,
                                   counterfactual=pert_expr, n_deg=20)
pearson, _ = pearsonr(true_lfc[deg], pred_lfc[deg])
plot_lfc(true_lfc, pred_lfc, deg, gene_names, holdout_ct, pearson)